Of course, it was an illusion that I would be able to get straight back to the robot after vacation, there were a few other jobs waiting like the Dyalog’13 Conference Programme (the DyaBot will be making a couple of appearances, of course!). However, it appears I have now made enough flour to be able to remove my nose from the grindstone for a bit and spend more time with the robot, so I expect to be back to posting every week or so from now on, as we prepare to demonstrate an autonomously navigating robot at the conference!
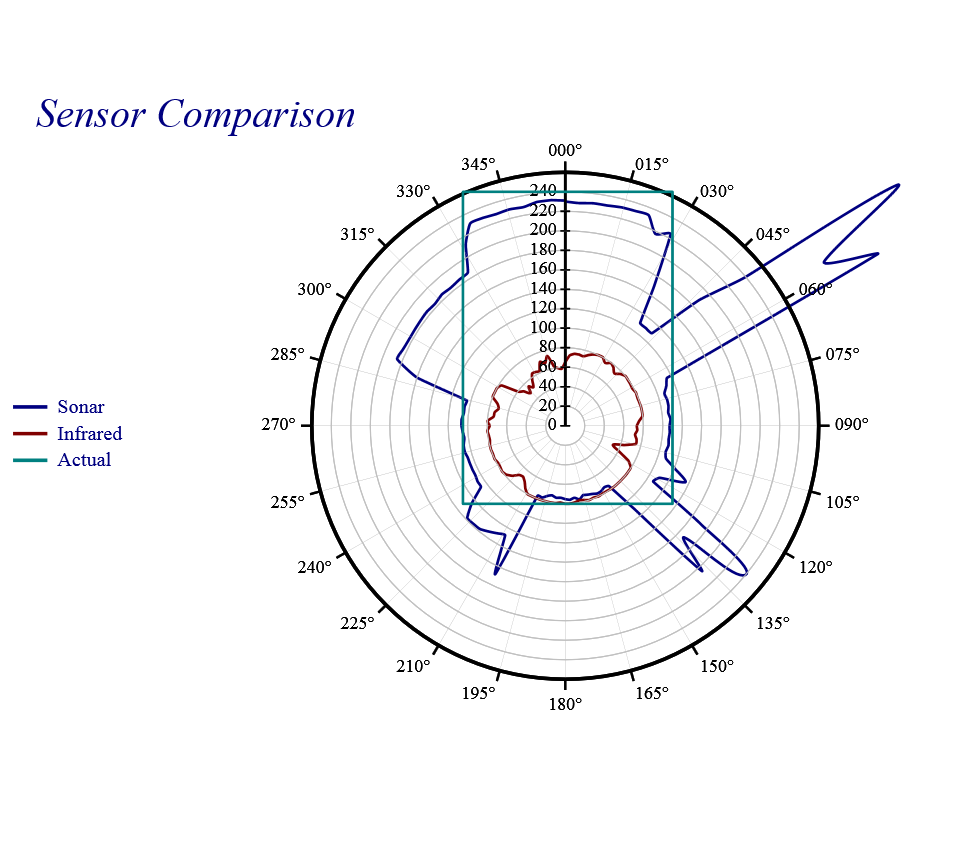
Anyhow, here is a chart with the first recorded data from the LV-EZ4 ultrasonic sensor (sonar) – using RainPro, as demonstrated in the post on visualising sensor data. Many thanks to Stefano Lanzavecchia for help with the math required to generate the co-ordinates of a rectangle in a polar chart:
The robot was placed in my kitchen (the setting for several robot videos), about 80cm from the back wall, 240cm from the front, and roughly halfway between the sides. The green rectangle labelled “actual” above shows the location of the walls relative to the bot. It was commanded to rotate through 360 degrees, recording the readings from the IR (red line) and Sonar (blue) sensors, which were both pointing straight ahead. Ideally, the blue line should have traced an identical rectangle. The red line essentially traces an 80cm circle plus noise, this is because SHARP GP2Y0A21YK0F infrared sensor has a maximum range of 80cm.
Sonar Issues
The ultrasonic sensor has a range of at least 6-7m, and is our choice for long-range distance measurements. However, what I believe the graph shows, is that we have a serious problem with reflections. Essentially, it appears that when the sonar beam hits a wall at certain angles, there is very little direct return; instead the beam is reflected. The return signals that we are getting from roughly 60 and 315 degrees look like reflections of the back wall – these reflections may be enhanced by the fact that there is a refrigerator at 60 and a dishwasher at 315 (metal surfaces). The signals at 135 and 220 degrees could be reflections of the robot itself, the beam having been reflected twice in a corner of the room.
Another thing that is not immediately evident from the above image, but took me by surprise studying the data sheet, was that the sonar beam is a quite a bit wider than I expected – as much as 30 degrees at close range, getting narrower as the distance increases (see the data sheet). In other words, we have some work to do in order to generate accurate maps of the universe based on the current set of sensors.
Will we succeed? To be continued …

 Follow